Tabulate enables users to embed Tabulate sheet contents in Present dashboards, Publications, and in Illustrations. This functionality extends access to Tabulate sheet outcomes even for users who do not have access to Tabulate. Users can select and save visual areas in their Tabulate worksheets and embed those visual areas in presentations, publications, and illustrations.
As well as using visual areas when embedding tabulation data as described here, you can also use visual areas when using a tabulation as a data source (the data source is not the whole spreadsheet, but just the area defined as a visual area or discovery area).
Note: A "discovery area" is a special type of visual area that is generated automatically on adding linked discovery data to your tabulation. For more information, see Working with discoveries in tabulations.
Adding Visual Areas
Step 1: Add a visual area to your tabulation
From the tabulation:
- Select the area that you want to include in your visual area.
- From the Tabulate ribbon, click Visual Area (purple highlight) > Set Visual Area.
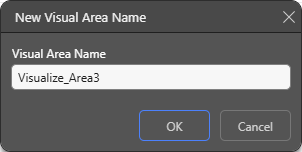
- Enter a name for the selected area. Tip: Don't use spaces in the name.
- Click OK.
This will be the section of your tabulation that is embedded in your presentation, publication, or illustration, acts as a data source, and so on.


The New Visual Area Name dialog opens:

Step 2: Embed your visual area in another file
From the open Presentation, Publication, or Illustration:
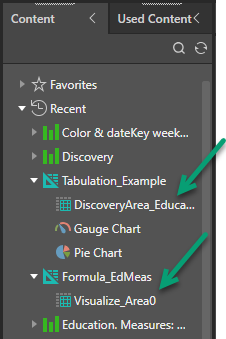
- In the Content panel, select the visual area from the saved Tabulation
- Drag the Visual Area onto the canvas.
- When using disparate data sources in the Present or Publish content item, use Cross Model Mapping to define the relationship between the model used by the data in Tabulate and the model used by the other data sources in Present and Publish.

Visual Areas and Discovery Areas are shown as sub-menu options for tabulations.
